The niranjan shah stadium rajkot pitch report provides documented evidence of ground behaviour across 16 international matches played between 2013 and 2016.
This analysis examines scoring patterns, result distribution, and format-specific outcomes at this Gujarat venue.
The ground has hosted three Test matches, seven ODIs, and six T20Is involving multiple international teams.
Each format has produced measurable trends in batting versus bowling advantages.
Statistical examination of niranjan shah stadium rajkot records in odi, t20i, test matches reveals distinct patterns in innings-wise scoring, toss impact, and surface deterioration.
Data collected from completed matches forms the basis of this ground behaviour assessment.
Niranjan Shah Stadium Rajkot Records in ODI, T20I & Test
This report documents verified outcomes without subjective interpretation. All statistics presented are derived from official match records.
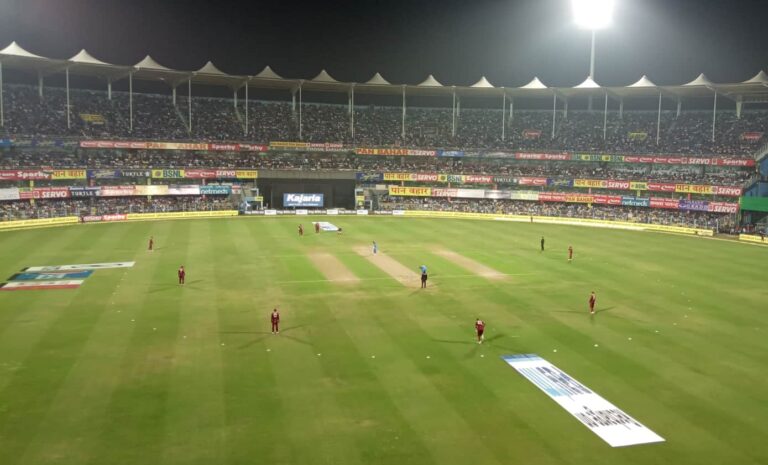
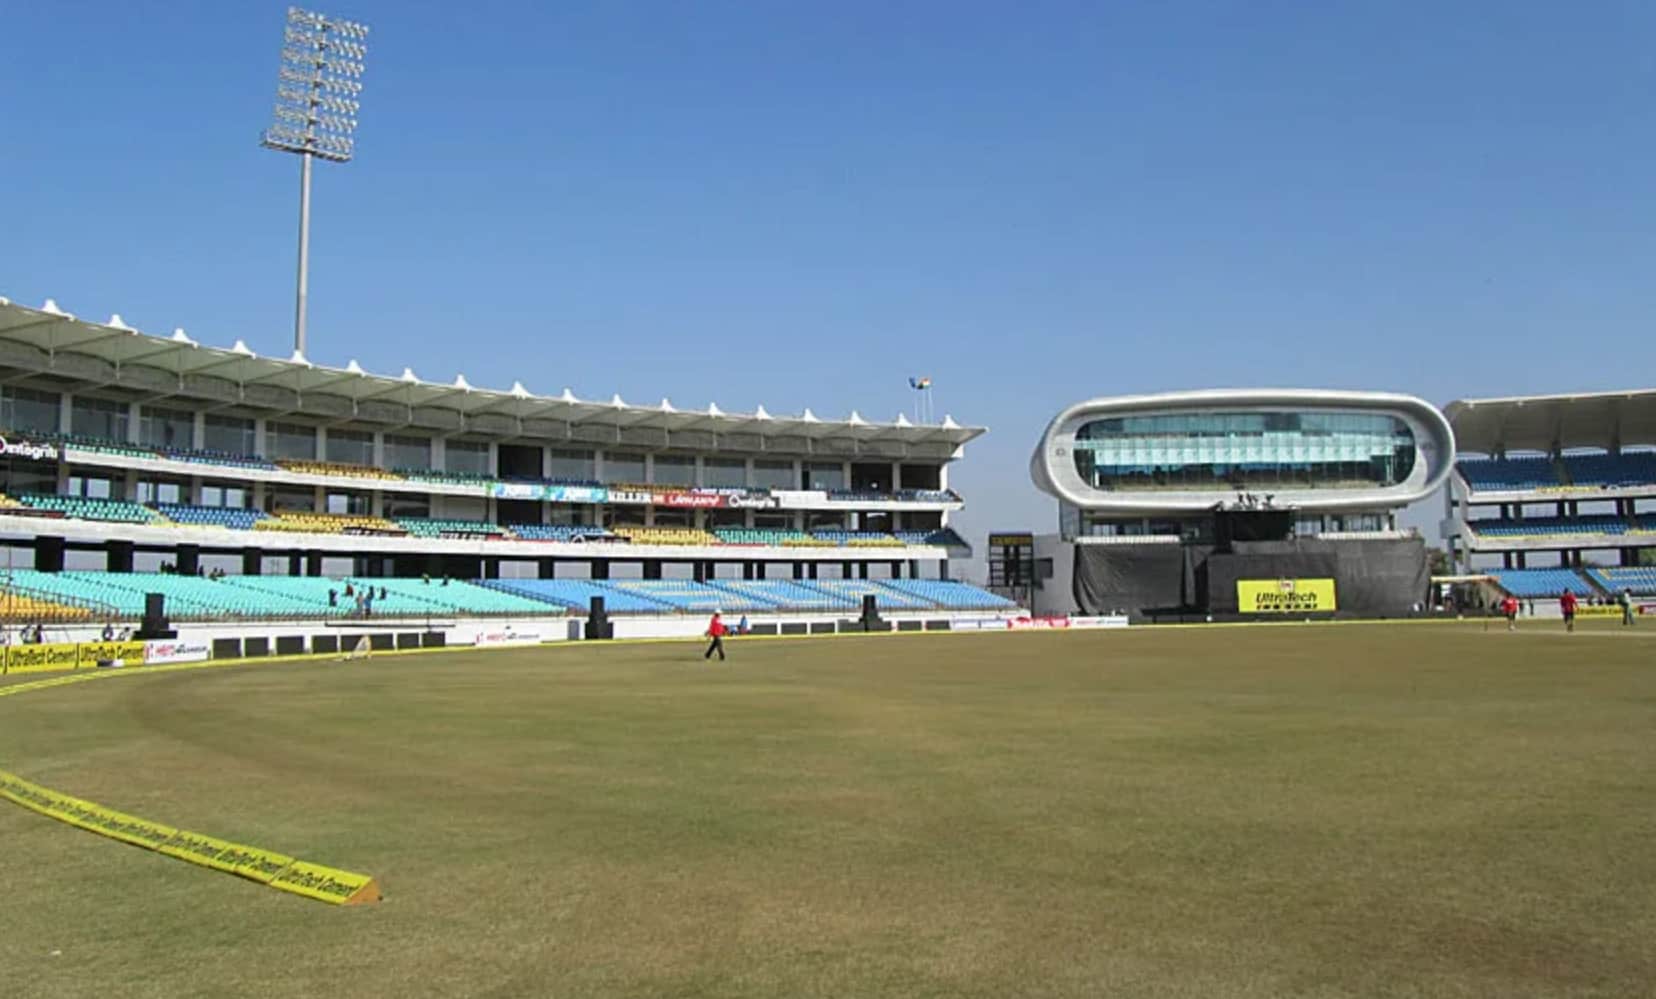
Saurashtra Cricket Association Stadium, Rajkot
The venue commenced international cricket operations in 2013 with ODI and T20I matches.
Test cricket was introduced in 2016. The stadium is situated in Khandheri on the Jamnagar Highway.
The facility serves as Saurashtra’s home ground for domestic cricket competitions. Infrastructure includes flood lighting for day-night matches.
| Feature | Details |
|---|---|
| Location | Khandheri, Rajkot, Gujarat, India |
| Also Known As | Saurashtra Cricket Association Stadium |
| Opened | 2009 |
| Capacity | 28,000 |
| Home Team | Saurashtra |
| Flood Lights | Yes |
| Pitch Type | Grass |
| Time Zone | UTC +05:30 |
Niranjan Shah Stadium Pitch Report: Batting or Bowling?
Match outcomes indicate batting advantages across all three formats. The surface composition supports run accumulation with reduced assistance for bowling units.
Documented pitch behaviour patterns:
- Hard surface providing consistent bounce throughout matches
- New ball movement restricted to early overs only
- Run-scoring rates increase after the initial phase
- Spin effectiveness is limited until significant pitch wear occurs
First innings totals consistently exceed second innings averages across formats. Teams winning tosses have opted to bat first in the majority of matches.
Niranjan Shah Stadium Records: Overall Cricket Format Ground Figures
Result distribution across 16 matches shows that batting-first advantages are strongest in the ODI format. Test matches display similar patterns with declining innings averages.
T20I results demonstrate more balanced outcomes compared to longer formats. Teams bowling first have recorded two wins from six matches.
| Format | Played | Bat First Wins | Bowl First Wins | Inaugural Match |
|---|---|---|---|---|
| Test | 3 | 2 | 0 | 2016 |
| One-Day Internationals | 7 | 6 | 1 | 2013 |
| Twenty20 Internationals | 6 | 4 | 2 | 2013 |
Niranjan Shah Stadium Test Records
Test match data reveals progressive innings score reduction. First innings average of 543 drops to 147 in the fourth innings attempts.
The Niranjan Shah Stadium Rajkot Test Records show no successful fourth innings chases. Both completed results occurred through teams batting first.
Pitch deterioration affects fourth innings batting significantly. The 527-run difference between first and fourth innings averages indicates substantial surface change.
| Stats | Value |
|---|---|
| Total Matches | 3 |
| Matches won batting first | 2 |
| Matches won bowling first | 0 |
| Average 1st Innings score | 543 |
| Average 2nd Innings score | 329 |
| Average 3rd Innings score | 295 |
| Average 4th Innings score | 147 |
| Highest total recorded | 649/9 by IND vs WI |
| Lowest total recorded | 122/10 by ENG vs IND |
Niranjan Shah Stadium ODI Records
ODI match behaviour shows consistent first innings advantages. Six matches from seven were won by teams setting targets.
The Niranjan Shah Stadium Rajkot ODI Records indicate a 78-run difference between batting first and chasing averages. The highest successful chase reached 241 runs only.
Teams defending totals above 270 have maintained unbeaten records. The lowest defended total of 270 demonstrates difficulty in chasing even moderate targets.
| Stats | Value |
|---|---|
| Total Matches | 7 |
| Matches won batting first | 6 |
| Matches won bowling first | 1 |
| Average 1st Innings score | 332 |
| Average 2nd Innings score | 254 |
| Highest total recorded | 435/5 by INDW vs IREW |
| Lowest total recorded | 131/10 by IREW vs INDW |
| Highest score chased | 241/4 by INDW vs IREW |
| Lowest score defended | 270/7 by RSA vs IND |
Niranjan Shah Stadium T20I Records
T20I match behaviour exhibits 40-run average difference between innings. Four matches from six resulted in batting-first victories.
The Niranjan Shah Stadium Rajkot T20I Records document successful chases up to 202 runs. This represents the format’s highest successful target at this venue.
Defending teams have succeeded when restricting opponents below 172. The 228-run highest total and 87-run lowest total indicate significant match-to-match variation.
| Stats | Value |
|---|---|
| Total Matches | 6 |
| Matches won batting first | 4 |
| Matches won bowling first | 2 |
| Average 1st Innings score | 186 |
| Average 2nd Innings score | 146 |
| Highest total recorded | 228/5 by IND vs SL |
| Lowest total recorded | 87/10 by RSA vs IND |
| Highest score chased | 202/4 by IND vs AUS |
| Lowest score defended | 171/9 by ENG vs IND |
Niranjan Shah Stadium Weather Report (January)
January weather patterns in Rajkot support scheduled cricket without interruptions. Temperature ranges remain suitable for daytime cricket.
Precipitation probability during this month records minimal interference with match schedules. Historical weather data confirms consistent playing conditions.
| Location | Weather | Temperature | Rain Chance |
|---|---|---|---|
| Rajkot | Clear & Dry | 18–28°C | Very Low |
FAQs
- Q1. What is the seating capacity of Niranjan Shah Stadium?
The venue accommodates 28,000 spectators.
- Q2. Which format shows strongest batting-first advantage?
ODI format records demonstrate the highest batting-first success rate at 85.7%.
- Q3. Have any fourth innings Test chases succeeded at this ground?
No fourth innings Test victories have been recorded across three matches.
- Q4. What is the average first innings score across all formats?
Test average is 543, ODI average is 332, and T20I average is 186.
Conclusion:
The niranjan shah stadium rajkot pitch report establishes consistent batting advantages through documented match outcomes.
Analysis of niranjan shah stadium rajkot records in odi, t20i, test matches confirms format-specific patterns.
Test cricket shows progressive innings decline from 543 to 147 runs.
ODI matches demonstrate 78-run differences between batting first and chasing averages. T20I results indicate 40-run gaps between innings totals.
Ground behaviour summary:
- Batting-friendly surface with hard composition and true bounce characteristics
- Format trends favor the first innings across all match types, with the strongest effect in ODIs
- January weather reliability supports uninterrupted match completion
- Historical consistency maintained across 16 international matches spanning three formats
Also Check:
- BRSABV Ekana Cricket Stadium Records
- HPCA Stadium Dharamsala Records
- Most Beautiful Cricket Stadium In The World
- Maharaja Yadavindra Singh International Cricket Stadium Records
- Narendra Modi Stadium Records in Test, ODI, and T20I