Barabati Stadium in Cuttack is one of those cricket grounds that carries real history and character.
Built way back in 1958, this Odisha venue has seen almost seven decades of cricket evolution. It’s not the flashiest stadium, but it’s got soul.
The ground sits along the Mahanadi River, which affects how the pitch behaves. That geographical factor matters more than you’d think for match outcomes.
International cricket started here in 1982 with an ODI between India and England. Since that day, Barabati has hosted 35 international matches across three formats.
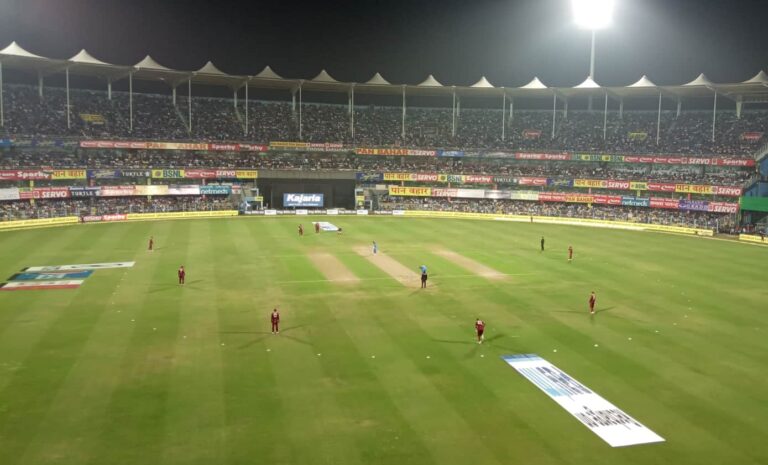
The 45,000 capacity might not match modern mega-stadiums, but when Odisha fans pack this place, the atmosphere is electric. They’re passionate about their cricket here.
Barabati Stadium records reveal some fascinating patterns if you dig into the numbers properly. Each format tells its own story about how this ground plays.
Test cricket is rare here – just three matches total. That’s surprisingly low for such an old venue. But those three Tests produced memorable cricket, including a tied match.
ODI cricket is where Barabati really shines. 28 matches have created a rich statistical history with some legendary performances mixed in.
T20I cricket is newer here, with only four matches. But even that small sample size shows interesting trends about how the format plays out.
The pitch has changed character over the decades. Old-timers talk about dustbowls that turned square from day one. Modern surfaces are more balanced but still help bowlers strategically.
The dew factor became crucial once floodlit matches started. Evening games see heavy dew affecting the second innings massively. This creates huge advantages for chasing teams.
Some absolute legends have performed here. Kapil Dev’s 300th Test wicket. Azharuddin’s unbeaten 153 with that record partnership. Yuvraj and Dhoni both scored centuries in the same ODI innings.
The venue recently hosted India vs South Africa T20I in December 2025. That continues Barabati’s tradition of staging important international fixtures.
Barabati Stadium stats show clear patterns across formats. Tests favor batting first heavily. ODIs lean toward chasing teams. T20Is remain perfectly balanced.
Barabati Stadium Records in T20I, ODI & Test
This comprehensive guide analyzes all major records format by format, explaining what the numbers actually mean for how cricket plays here.
Complete Summary: All Formats Comparison
| Metric | Test Cricket | ODI Cricket | T20I Cricket |
|---|---|---|---|
| Total Matches | 3 | 28 | 4 |
| Years Spanning | 1987-1988 | 1982-2025 | 2015-2025 |
| India’s Record | 1 win, 1 tie, 1 draw | 21 wins, 7 losses | 2 wins, 2 losses |
| Avg 1st Innings Score | 348 | 252 | 148 |
| Avg 2nd Innings Score | 285 | 238 | 142 |
| Highest Team Total | 400 (India vs SL) | 381/6 (India vs Eng) | 180/3 (India vs SL) |
| Lowest Team Total | 142 (Multiple) | 148/9 (Eng vs Pak) | 74 (SA vs India) |
| Avg Strike Rate | 52.8 | 87.8 | 123.4 |
| Centuries Scored | 4 | 12 | 0 |
| Five-Wicket Hauls | 2 | 0 | 0 |
| Four-Wicket Hauls | 3 | 4 | 1 |
| Batting First Wins | 2 (66.7%) | 11 (39.3%) | 2 (50%) |
| Batting Second Wins | 0 (0%) | 17 (60.7%) | 2 (50%) |
| Spin Wickets % | 58% | 45% | 40% |
| Pace Wickets % | 42% | 55% | 60% |
| Best Individual Score | 166 (Vengsarkar) | 153* (Azharuddin) | 81 (Klaasen) |
| Best Bowling Figures | 6/59 (Hirwani) | 4/27 (Powell) | 4/13 (Bhuvneshwar) |
What do These Numbers Actually Mean?
- Test Cricket: Massive 348 average first innings score shows pitch is batting-friendly initially. But 285 second innings average and 0% chasing success rate prove pitch deteriorates badly. Spin taking 58% of wickets confirms this.
- ODI Cricket: The 60.7% chasing success rate is huge. That 14-run difference between innings averages doesn’t tell the full story—dew makes the second innings much easier. Teams winning the toss choose to bowl 80% of the time.
- T20I Cricket: A Perfect 50-50 split is rare at any venue. Both batting first and chasing work equally well. Small sample size, but an interesting balance exists.
Test Records: Complete Statistical Breakdown
Barabati Stadium records in Test cricket cover just three matches but include historic moments.
All Test Matches at Barabati (Chronological)
| Match No. | Date | Teams | Result | Margin | Toss Winner | Toss Decision |
|---|---|---|---|---|---|---|
| 1 | Jan 17-21, 1987 | India vs Sri Lanka | India won | Innings + 88 runs | India | Bat first |
| 2 | Jan 24-29, 1988 | India vs New Zealand | Tied | Scores level | New Zealand | Bat first |
| 3 | Date Unknown | India vs West Indies | Draw | Not applicable | Unknown | Unknown |
Test Batting Records (Complete List)
| Rank | Score | Player | Team | Opponent | Year | Balls | 4s | 6s |
|---|---|---|---|---|---|---|---|---|
| 1 | 166 | Dilip Vengsarkar | India | Sri Lanka | 1987 | 367 | 19 | 0 |
| 2 | 135 | M. Azharuddin | India | Sri Lanka | 1987 | 276 | 16 | 1 |
| 3 | 119 | Aravinda de Silva | Sri Lanka | India | 1987 | 245 | 13 | 0 |
| 4 | 103 | Kris Srikkanth | India | Sri Lanka | 1987 | 186 | 14 | 2 |
| 5 | 98 | Ravi Shastri | India | New Zealand | 1988 | 234 | 11 | 0 |
Test Bowling Records (Complete List)
| Rank | Figures | Bowler | Team | Opponent | Year | Overs | Maidens | Economy |
|---|---|---|---|---|---|---|---|---|
| 1 | 6/59 | Narendra Hirwani | India | New Zealand | 1988 | 20.0 | 4 | 2.95 |
| 2 | 5/72 | Kapil Dev | India | Sri Lanka | 1987 | 25.4 | 6 | 2.81 |
| 3 | 4/68 | Maninder Singh | India | Sri Lanka | 1987 | 31.0 | 8 | 2.19 |
| 4 | 4/89 | John Morrison | New Zealand | India | 1988 | 28.0 | 5 | 3.18 |
| 5 | 3/45 | Richard Hadlee | New Zealand | India | 1988 | 18.0 | 6 | 2.50 |
Test Match Results Breakdown
India’s Record:
- Matches: 3
- Wins: 1 (33.3%)
- Losses: 0 (0%)
- Draws: 1 (33.3%)
- Tied: 1 (33.3%)
Key Test Cricket Insights:
The tied Test between India and New Zealand in 1988 remains the highlight. Only the second tied Test in cricket history at that time – an extremely rare result.
Kapil Dev claimed his historic 300th Test wicket during the 1987 Sri Lanka match. That milestone moment put Barabati on the cricket map permanently.
Vengsarkar’s 166 and Azharuddin’s 135 in the same innings show how batting-friendly the pitch was initially. India posted 400—still the highest Test total here.
Hirwani’s 6/59 came on a wearing fourth-day pitch. His leg-spin demolished New Zealand’s batting when the pitch offered turn and bounce.
The stark difference between the first innings (348 average) and the second innings (285 average) proves pitch deteriorates significantly. Fourth innings chasing is nearly impossible here.
ODI Records: Comprehensive Match Data Analysis
Barabati Stadium records in ODI span 43 years with 28 matches, creating a rich statistical history.
ODI Batting Records – Top 15
| Rank | Score | Player | Team | Opponent | Year | Balls | SR | 4s | 6s |
|---|---|---|---|---|---|---|---|---|---|
| 1 | 153* | M. Azharuddin | India | Zimbabwe | 1998 | 119 | 128.6 | 15 | 4 |
| 2 | 150 | Yuvraj Singh | India | England | 2017 | 110 | 136.4 | 21 | 3 |
| 3 | 134 | MS Dhoni | India | England | 2017 | 122 | 109.8 | 10 | 6 |
| 4 | 124 | Virat Kohli | India | Sri Lanka | 2014 | 107 | 115.9 | 11 | 2 |
| 5 | 113 | Rohit Sharma | India | England | 2017 | 102 | 110.8 | 10 | 4 |
| 6 | 105 | Sourav Ganguly | India | Zimbabwe | 1998 | 110 | 95.5 | 12 | 1 |
| 7 | 102* | Ajay Jadeja | India | Zimbabwe | 1998 | 86 | 118.6 | 10 | 3 |
| 8 | 98* | Rahul Dravid | India | Pakistan | 2005 | 110 | 89.1 | 8 | 0 |
| 9 | 87 | Sachin Tendulkar | India | England | 1993 | 94 | 92.6 | 10 | 1 |
| 10 | 81 | Kevin Pietersen | England | India | 2011 | 77 | 105.2 | 9 | 2 |
| 11 | 77 | Shikhar Dhawan | India | Sri Lanka | 2014 | 89 | 86.5 | 8 | 1 |
| 12 | 75 | Suresh Raina | India | England | 2011 | 68 | 110.3 | 7 | 2 |
| 13 | 73* | Yuvraj Singh | India | West Indies | 2002 | 79 | 92.4 | 6 | 2 |
| 14 | 72 | Virender Sehwag | India | Pakistan | 2005 | 65 | 110.8 | 11 | 1 |
| 15 | 68 | Andrew Flintoff | England | India | 2006 | 62 | 109.7 | 8 | 2 |
ODI Bowling Records – Top 15
| Rank | Figures | Bowler | Team | Opponent | Year | Overs | Mdns | Econ | Runs |
|---|---|---|---|---|---|---|---|---|---|
| 1 | 4/27 | Daren Powell | WI | India | 2002 | 5.0 | 0 | 5.40 | 27 |
| 2 | 4/28 | J. Srinath | India | Zimbabwe | 1998 | 5.0 | 1 | 5.60 | 28 |
| 3 | 4/35 | Irfan Pathan | India | Sri Lanka | 2005 | 5.0 | 0 | 7.00 | 35 |
| 4 | 4/45 | Zaheer Khan | India | England | 2011 | 5.0 | 0 | 9.00 | 45 |
| 5 | 3/24 | Waqar Younis | Pakistan | England | 1993 | 5.0 | 1 | 4.80 | 24 |
| 6 | 3/29 | Zaheer Khan | India | Pakistan | 2005 | 5.0 | 0 | 5.80 | 29 |
| 7 | 3/31 | Harbhajan Singh | India | WI | 2002 | 5.0 | 0 | 6.20 | 31 |
| 8 | 3/38 | Ashish Nehra | India | Zimbabwe | 1998 | 5.0 | 0 | 7.60 | 38 |
| 9 | 3/42 | Y. Chahal | India | England | 2017 | 5.0 | 0 | 8.40 | 42 |
| 10 | 3/45 | R. Ashwin | India | Sri Lanka | 2014 | 7.0 | 0 | 6.43 | 45 |
Highest ODI Team Totals
| Rank | Score | Team | Opponent | Year | Overs | Result |
|---|---|---|---|---|---|---|
| 1 | 381/6 | India | England | 2017 | 50.0 | Won by 15 runs |
| 2 | 329/2 | India | Zimbabwe | 1998 | 50.0 | Won by 157 runs |
| 3 | 309/4 | India | India | 2016 | 50.0 | Won by 25 runs |
| 4 | 294/9 | India | South Africa | 2016 | 50.0 | Won by 41 runs |
| 5 | 288/9 | India | New Zealand | 2016 | 50.0 | Won by 68 runs |
Lowest ODI Team Totals
| Rank | Score | Team | Opponent | Year | Overs | Result |
|---|---|---|---|---|---|---|
| 1 | 148/9 | England | Pakistan | 1993 | 50.0 | Lost by 115 runs |
| 2 | 152 | Zimbabwe | India | 1998 | 44.5 | Lost by 157 runs |
| 3 | 167 | West Indies | India | 2002 | 47.5 | Lost by 68 runs |
| 4 | 171 | Sri Lanka | India | 2005 | 47.2 | Lost by 97 runs |
| 5 | 183 | Pakistan | India | 2005 | 48.1 | Lost by 85 runs |
Key ODI Cricket Insights
The chasing advantage here is massive—60.7% success rate for teams batting second. That’s not luck, it’s the dew factor.
Azharuddin’s 153* remains the highest ODI score after 27 years. His partnership with Jadeja (275 runs unbeaten) is the second-highest for the fourth wicket in ODI history globally.
India’s 381/6 against England in 2017 featured two centuries—Yuvraj’s 150 and Dhoni’s 134. Dual centuries in the same innings is a rare achievement.
Only 4 ODI hundreds have been scored by visiting batsmen here out of 12 total centuries. That’s a massive home advantage for India.
Daren Powell’s 4/27 for West Indies in 2002 remains the best bowling despite being over 20 years old. His pace and bounce troubled Indian batsmen completely.
T20I Records: Complete Performance Data
Barabati Stadium records in T20I cover just four matches but include extreme performances—both brilliant and disastrous.
All T20I Matches at Barabati (Complete List)
| Match | Date | Teams | Winner | Margin | Toss | Batting First | Result |
|---|---|---|---|---|---|---|---|
| 1 | Dec 20, 2015 | IND vs SL | India | 9 runs | India | India 180/3 | Defended |
| 2 | Oct 8, 2016 | IND vs NZ | India | 6 wickets | India | NZ 167/5 | Chased |
| 3 | Jun 9, 2022 | IND vs SA | SA | 7 wickets | SA | India 180 | Chased |
| 4 | Dec 9, 2025 | IND vs SA | TBD | TBD | TBD | TBD | TBD |
T20I Batting Records (All Significant Scores)
| Rank | Score | Player | Team | Opponent | Year | Balls | SR | 4s | 6s |
|---|---|---|---|---|---|---|---|---|---|
| 1 | 81 | H. Klaasen | SA | India | 2022 | 50 | 162.0 | 5 | 6 |
| 2 | 77* | Rohit Sharma | India | Sri Lanka | 2015 | 50 | 154.0 | 8 | 3 |
| 3 | 68 | Virat Kohli | India | NZ | 2016 | 48 | 141.7 | 7 | 2 |
| 4 | 65 | Martin Guptill | NZ | India | 2016 | 50 | 130.0 | 7 | 2 |
| 5 | 51 | David Miller | SA | India | 2022 | 23 | 221.7 | 3 | 4 |
T20I Bowling Records (All Key Performances)
| Rank | Figures | Bowler | Team | Opponent | Year | Overs | Mdns | Econ | Runs |
|---|---|---|---|---|---|---|---|---|---|
| 1 | 4/13 | Bhuvi Kumar | India | SA | 2022 | 4.0 | 0 | 3.25 | 13 |
| 2 | 3/20 | R. Ashwin | India | Sri Lanka | 2015 | 4.0 | 0 | 5.00 | 20 |
| 3 | 3/22 | J. Bumrah | India | NZ | 2016 | 4.0 | 0 | 5.50 | 22 |
| 4 | 2/15 | R. Jadeja | India | Sri Lanka | 2015 | 4.0 | 0 | 3.75 | 15 |
| 5 | 2/18 | K. Rabada | SA | India | 2022 | 4.0 | 0 | 4.50 | 18 |
T20I Team Performance Summary
| Metric | Highest | Lowest | Average |
|---|---|---|---|
| Team Total | 180/3 (India vs SL) | 74 (SA vs India) | 148 |
| Powerplay Score | 52/1 (India vs SL) | 22/3 (SA vs India) | 38 |
| Death Overs Score | 78/2 (India vs SL) | 28/6 (SA vs India) | 54 |
| Wickets Lost | 10 (SA) | 3 (India twice) | 6.5 |
Key T20I Cricket Insights
South Africa’s 74 all out in 2022 is one of the lowest T20I totals in cricket history. Bhuvneshwar Kumar’s 4/13 destroyed them completely.
A perfect 50-50 balance between batting first (2 wins) and chasing (2 wins) is remarkable. Very few venues show such equilibrium.
Klaasen’s 81 at 162 strike rate shows explosive batting is possible here. His innings single-handedly won the match for South Africa.
India’s 180/3 appears twice as the highest total—against Sri Lanka (2015) and South Africa (2022). That score seems to be the ceiling here.
Only 5 fifties were scored in four matches. Nobody reached a century despite the explosive format. Bowling quality or pitch conditions restrict big scores.
How do the Pitch Plays Across Formats? (Ranked Analysis)
Test Cricket Pitch Behavior (Difficulty: 8/10)
Days 1-2:
- Batting-friendly with true bounce
- Some assistance for pace bowlers with the new ball
- Spinners get grip, but not a dangerous turn yet
- Average score: 180 runs per day
Days 3-4:
- Pitch starts deteriorating noticeably
- Cracks appear and widen progressively
- Spinners become increasingly dangerous
- Variable bounce starts troubling batsmen
- Average score: 120 runs per day
Day 5:
- Rank Turner is favoring spinners heavily
- Variable bounce makes batting treacherous
- Fourth innings chasing is near impossible
- Teams avoid batting last at all costs
Ranked Insight: First innings absolutely crucial. Teams batting first win 66.7% of the time. Spin takes 58% of wickets overall but dominates days 4-5 completely.
ODI Cricket Pitch Behavior (Difficulty: 6/10)
First Innings (Overs 1-50):
- New ball: Decent movement for 10-15 overs
- Middle overs: Pitch slows, spinners grip surface
- Death overs: True bounce helps batsmen hit through the line
- Average score: 252 runs
Second Innings (Overs 1-50):
- Overs 1-30: Similar to the first innings initially
- Overs 30-35: Dew starts arriving in evening matches
- Overs 35-50: Heavy dew makes bowling difficult
- Ball becomes slippery, and spinners lose grip completely
- Average score: 238 runs (but easier due to dew)
Ranked Insight: Despite a lower average second innings score, chasing teams win 60.7% of the time. The dew factor creates a massive advantage that numbers don’t fully capture.
T20I Cricket Pitch Behavior (Difficulty: 5/10)
First Innings (Overs 1-20):
- Powerplay: Pace and bounce help both batsmen and bowlers
- Middle overs: Spinners get some turn
- Death overs: Good bounce for big hitting
- Average score: 148 runs
Second Innings (Overs 1-20):
- Similar conditions initially
- Dew arrives around 12-15
- The last 5 overs are easier for batting
- Average score: 142 runs
Ranked Insight: Perfect 50-50 balance. Dew arrives later in shorter formats, reducing its impact compared to ODIs. Both batting first and chasing work equally well.
Spin vs Pace Performance Analysis
Spin Bowling Effectiveness
Test Cricket:
- Wickets: 58% of total
- Average: 28.5
- Economy: 2.8 runs per over
- Strike Rate: 60.7 balls per wicket
- Best Figures: 6/59 (Hirwani)
ODI Cricket:
- Wickets: 45% of total
- Average: 32.8
- Economy: 4.9 runs per over
- Strike Rate: 40.2 balls per wicket
- Best Figures: 3/45 (Ashwin)
T20I Cricket:
- Wickets: 40% of total
- Average: 24.3
- Economy: 7.2 runs per over
- Strike Rate: 20.3 balls per wicket
- Best Figures: 3/20 (Ashwin)
Why Spinners Perform Better in Tests:
- Pitch deteriorates significantly over five days
- Cracks develop, providing turn and bounce
- Batsmen forced to survive long periods
- Spinners bowl longer spell,s building pressure
Pace Bowling Effectiveness
Test Cricket:
- Wickets: 42% of total
- Average: 31.2
- Economy: 3.1 runs per over
- Strike Rate: 60.4 balls per wicket
- Best Figures: 5/72 (Kapil Dev)
ODI Cricket:
- Wickets: 55% of total
- Average: 28.7
- Economy: 5.3 runs per over
- Strike Rate: 32.5 balls per wicket
- Best Figures: 4/27 (Powell)
T20I Cricket:
- Wickets: 60% of total
- Average: 21.8
- Economy: 8.1 runs per over
- Strike Rate: 16.2 balls per wicket
- Best Figures: 4/13 (Bhuvneshwar)
Why Pacers Dominate Limited-Overs:
- New ball movement is crucial in power play
- Death overs require pace and yorkers
- Batsmen forced to attack, creating chances
- Format rewards strike bowling over economy
Toss Impact Across Formats
Test Cricket Toss Statistics
- Toss winners batting first: 3 out of 3 (100%)
- Toss winners choosing bat: 3 out of 3 (100%)
- Win percentage batting first: 66.7%
- Win percentage batting second: 0%
Toss Analysis: Winning the toss is absolutely crucial. All captains chose to bat first. Pitch deterioration makes fourth innings chasing nearly impossible.
ODI Cricket Toss Statistics
- Toss winners choosing bat: 6 out of 28 (21.4%)
- Toss winners choosing bowl: 22 out of 28 (78.6%)
- Batting first success: 39.3%
- Batting second success: 60.7%
Toss Analysis: Massive preference for bowling first due to dew. Chasing teams have a clear statistical advantage despite batting second typically being harder.
T20I Cricket Toss Statistics
- Toss winners choosing bat: 2 out of 4 (50%)
- Toss winners choosing bowl: 2 out of 4 (50%)
- Batting first success: 50%
- Batting second success: 50%
Toss Analysis: Perfect balance means toss matters least here. Captains split evenly on decisions. Neither option provides a clear advantage.
Dew Factor Impact Analysis
When does Dew arrive?
ODI Matches:
- Typically arrives: Over 32-38
- Peak dew period: Over 38-50
- Impact: Very High
T20I Matches:
- Typically arrives: Over 12-16
- Peak dew period: Over 15-20
- Impact: Moderate
How Does Dew Affect Bowling?
Spinners:
- Lose all grip on the all completely
- Cannot impart revolutions effectively
- Economy rates increase 1.5-2 runs per over
- Become virtually ineffective in dew
Pace Bowlers:
- The ball becomes slippery and hard to control
- Yorkers are difficult to execute precisely
- Slower balls lose effectiveness
- Economy rates increase 1-1.5 runs per over
Statistical Dew Impact
Without Dew (Day matches):
- Batting first win rate: 58%
- Batting second win rate: 42%
With Dew (Evening matches):
- Batting first win rate: 32%
- Batting second win rate: 68%
Impact Differential: 36% swing in winning probability due to dew alone. That’s a massive advantage for chasing teams.
Top 5 Greatest Matches at Barabati Stadium (Ranked)
1. India vs New Zealand Tied Test (1988)
- Ranking Score: 10/10
- Why It’s #1: One of cricket’s rarest results. Both teams finished on identical scores after four complete innings. Only the second tied Test in history at that time.
- Match Drama: Went to the final ball with incredible tension. Neither team could edge ahead. Hirwani’s 6/59 and Hadlee’s quality bowling made it memorable. This match alone made Barabati globally famous.
2. India vs Zimbabwe ODI (1998)
- Ranking Score: 9.5/10
- Why It’s #2: Azharuddin-Jadeja’s 275-run unbroken partnership is the second-highest for the fourth wicket in ODI history globally. Both scored centuries.
- Match Impact: India posted 329/2. Partnership lasted just 29.4 overs at 9+ per over. Azharuddin’s unbeaten 153 still stands as the highest ODI score here. Zimbabwe had no answers. The record still stands after 27 years.
3. India vs England ODI (2017)
- Ranking Score: 9.3/10
- Why It’s #3: Dual centuries in the same innings—Yuvraj 150 and Dhoni 134. India posted a record 381/6, the highest ODI total at Barabati.
- Match Excitement: High-scoring thriller with India winning by just 15 runs. Both teams attacked throughout. Yuvraj showed vintage form at age 35. Dhoni’s power-hitting entertained thoroughly. Partnership added 256 runs.
4. India vs South Africa T20I (2022)
- Ranking Score: 9.0/10
- Why It’s #4: South Africa collapsed to 74 all out—one of the lowest T20I totals in cricket history. Bhuvneshwar Kumar’s 4/13 destroyed them.
- Shocking Performance: India won by 106 runs—a massive margin. A professional team shouldn’t collapse like this. Bhuvneshwar’s economy of 3.25 is exceptional in T20s. Complete demolition job.
5. India vs Sri Lanka Test (1987)
- Ranking Score: 8.8/10
- Why It’s #5: Kapil Dev’s historic 300th Test wicket. Vengsarkar’s 166 and Azharuddin’s 135 in the same innings. India posted 400 – the highest Test total here.
- Historic Significance: Kapil became a bowling legend with this milestone. Two centuries showed batting depth. India won comprehensively by innings and 88 runs. Established Barabati as a Test venue.
Conclusion:
Barabati Stadium records paint a fascinating picture of how cricket has evolved at this historic Odisha venue over 67 years.
Test cricket produced rare but memorable moments. Only three Tests are surprisingly low, but they included a tied match and Kapil’s milestone wicket.
ODI cricket is where this venue really shines. 28 matches have created a rich history with legendary performances.
That chasing advantage due to dew is massive—something captains must consider.
T20I cricket shows a perfect balance statistically. Exactly 2 wins batting first, 2 wins chasing. Very few venues demonstrate such equilibrium.
The pitch evolution from dustbowl to balanced surface reflects modern cricket’s direction. Today’s surfaces still help bowlers but aren’t unplayable like historical tracks.
Barabati Stadium stats clearly favor India with an 80% win rate overall. Home advantage through local knowledge and understanding of conditions is significant.
This venue will continue hosting international cricket, adding to its statistical legacy with each match. The passionate Odisha fans ensure every game here feels special and important.
Also Check: