Most Indian cricket grounds are batsmen’s paradises. Chinnaswamy, Wankhede, Eden Gardens – these venues regularly see 350+ ODI scores and 200+ T20 totals. Then there’s Ekana.
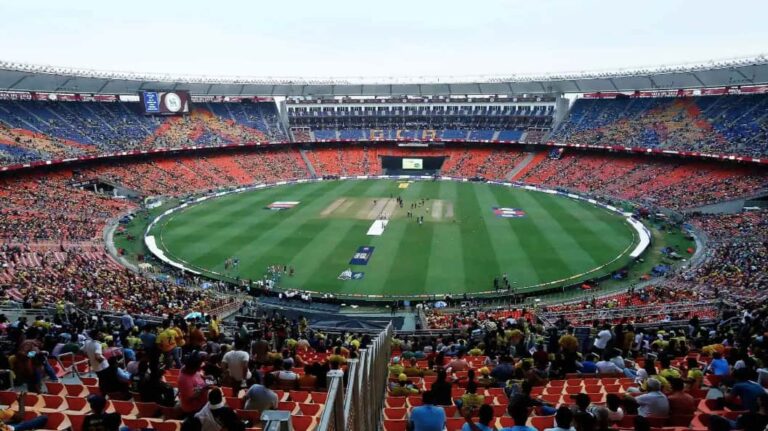
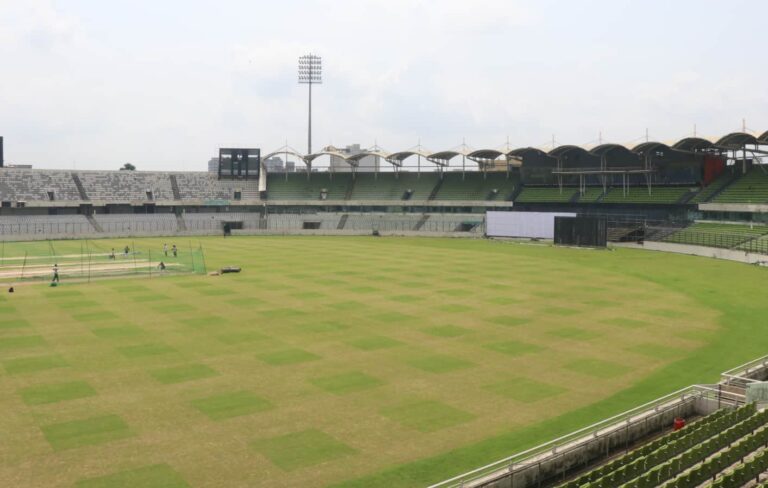
Ekana Cricket Stadium in Lucknow is different. Opened in 2017, this modern stadium with 50,000 capacity has produced scorecards that look nothing like typical Indian venues.
Low-scoring thrillers. Bowling dominance. Spinners running through lineups.
BRSABV Ekana Cricket Stadium Records in Test, ODIs, and T20I reveal a consistent pattern – this pitch doesn’t give batsmen anything easy.
The slow surface, massive boundaries, and spin-friendly nature create unique challenges across all formats.
Since its first international match, Ekana has hosted one Test, 14 ODIs, and 9 T20Is.
Every scorecard tells the same story: bowlers smile, batsmen struggle, tactical cricket wins.
BRSABV Ekana Cricket Stadium Records in Test, ODIs, and T20Is

Let’s break down actual scorecards and see what really happens when teams play at this ground.
Ekana Stadium: Quick Facts Snapshot
Before analyzing scorecards, here’s what defines this venue:
- Full Name: Bharat Ratna Shri Atal Bihari Vajpayee Ekana Cricket Stadium
- Location: Ekana Sportz City, Lucknow, Uttar Pradesh
- Opened: 2017
- Capacity: 50,000 spectators
- Floodlights: Yes (day-night matches supported)
- Home Teams: Uttar Pradesh (domestic), Lucknow Super Giants (IPL)
- Pitch Type: Slow, black soil surface
- Pitch Nature: Spin-friendly with low bounce
- Boundary Dimensions:
- Shortest: 63 meters
- Longest: 70 meters
- Typical Toss Decision: Bat first preferred
These aren’t just statistics. The 70-meter boundaries change how batsmen approach innings. The slow pitch forces tactical adjustments. Every number impacts actual scorecards.
Atal Bihari Vajpayee Stadium, Lucknow Pitch Report: Batting or Bowling?
Understanding the pitch explains why scorecards look the way they do.
Surface Behavior
The pitch is made of black soil. It’s slow from ball one. The ball doesn’t come onto the bat with pace. Batsmen can’t trust the bounce—it stays low throughout matches.
Fast bowlers get no help. The pitch absorbs pace. Even 140+ kph deliveries feel slower to batsmen. Movement through the air matters more than off the pitch.
Spin Impact Timeline
- Powerplay overs (1-10 in ODIs/T20s): Some carry exists. Spinners can still be effective, but pace is slightly better.
- Middle overs (11-40 in ODIs, 7-15 in T20s): Spin dominates completely. The ball grips, turns, and keeps low. This is where scorecards show wicket clusters.
- Death overs: Slower balls and yorkers work best. Spinners remain effective even in the final overs.
Batting Difficulty Over Time
- In Tests, batting gets progressively harder each day. The first innings might be manageable. By the fourth innings, the pitch is a minefield.
- In ODIs, the surface doesn’t deteriorate as badly. But it never becomes a batting paradise either. Scores stay controlled throughout 50 overs.
- In T20s, the short format prevents severe deterioration. But the pitch’s basic slowness never changes.
Dew Factor
Unlike Delhi or Mohali, Ekana doesn’t suffer from heavy dew. Night matches stay relatively dry. Bowlers can grip the ball properly even under lights.
This consistency means scorecards don’t show dramatic toss-based advantages in day-night games.
Toss Strategy Logic
Captains prefer batting first for psychological reasons. Setting a target and defending it suits this pitch better than chasing.
Why? Because even moderate totals become defendable. Scorecards prove that 220 in ODIs or 160 in T20s can win matches here.
The Lucknow Stadium pitch report batting or bowling answer is clear: bowling gets more help than batting across all formats.
Test Match Scorecard: Complete Breakdown
Only one Test has been played at Ekana – West Indies vs Afghanistan, November 2019. Let’s break down that scorecard innings by innings.
First Innings: Afghanistan’s Struggle
Afghanistan: 187 all out (75.3 overs)
Afghanistan batted first and immediately struggled. No batsman crossed 50. Their highest score was 45. The team took 75 overs to make 187—that’s barely 2.47 runs per over.
Rahkeem Cornwall destroyed them: 7 wickets for 75 runs in 25.3 overs. He bowled long spells, using flight and turn. The pitch gave him natural help.
This scorecard showed what Test cricket at Ekana means—survival is success.
Second Innings: West Indies Build Lead
West Indies: 277 all out (83.3 overs)
West Indies batted better but still took 83 overs for 277 runs. Run rate stayed below 3.5.
Shamarh Brooks scored 111 not out off 214 balls. That’s the only Test century at this venue. He batted almost 36 overs for his hundred. Every run was earned through patience and concentration.
Hamza Hotak fought back for Afghanistan: 5 wickets for 74 runs in 28.3 overs. Another spinner, another long spell, another proof that this pitch rewards slow bowling.
West Indies gained a 90-run lead. That advantage would prove decisive.
Third Innings: Complete Collapse
Afghanistan: 120 all out (43.1 overs)
This scorecard tells the real Ekana story. Afghanistan collapsed badly in their second innings. They couldn’t handle the deteriorating pitch.
Batting third here is a nightmare. The ball keeps lower. Turn increases. Batsmen have no answers.
West Indies spinners dominated again. The pitch had become almost unplayable by day 3-4.
Fourth Innings: Easy Chase
West Indies: 33 for 1 (6.2 overs)
West Indies needed just 31 runs. They knocked them off in 6.2 overs. Match over.
The scorecard shows how dominant bowling was throughout. Total runs in the match: 617 across four innings. That’s extremely low for Test cricket.
Test Scorecard Verdict
This single Test scorecard proves: batting fourth at Ekana is nearly impossible. The pitch’s slow, low nature becomes unplayable as the match progresses.
ODI Scorecard Trends: Numbers That Matter
Fourteen ODI matches produce fourteen different stories. But patterns emerge clearly.
Highest ODI Scorecard: South Africa 311/7
Match: South Africa vs Australia, October 12, 2023
This remains the highest ODI team total at Ekana. Let’s break it down:
- South Africa batted 50 full overs
- Run rate: 6.22 per over (good but not explosive)
- Quinton de Kock scored 109 off 106 balls
- Heinrich Klaasen contributed significantly
- Even with 311, they had to bat carefully
Australia chased but failed. Even 311—a big ODI score—was defendable on this pitch. The Ekana cricket stadium records scorecard from this match shows South African bowlers using the pitch perfectly in defense.
Lowest ODI Scorecard: England 129 All Out
Match: England vs India
England collapsed for 129 all out. This scorecard shows what happens when batsmen fail to adapt.
India’s spinners exploited the conditions. England tried aggressive cricket on a pitch that demands patience. Result: complete failure.
Typical ODI Scorecard Pattern
Looking at multiple scorecards:
- First innings: Usually 220-250
- Second innings: Often 200-230
- Wickets cluster in middle overs (20-40)
- Spinners take 3-4 wickets regularly
- Chase success rate: 71% (10 out of 14)
Why Chasing Works in ODI Scorecards?
Unlike Tests, ODI scorecards favor chasing teams. Three reasons:
- Teams know the target
- Pitch doesn’t deteriorate in 100 overs
- Dew doesn’t affect much
The Lucknow Cricket Stadium last match scorecard in ODIs typically shows successful chases. Teams pace their innings better when they know what’s needed.
Notable Individual Scorecard Contributions
- Shai Hope: 229 total runs across matches (most at venue)
Hope’s scorecards show consistency. He doesn’t play risky shots. He rotates strike. He builds innings methodically.
- Lizelle Lee: 132 not out (Women’s ODI)
Her scorecard remains the highest individual ODI score here. She faced 132 balls for 132 runs—perfect strike rotation without taking unnecessary risks.
ODI Scorecard Summary
Lucknow Cricket Stadium records in ODIs prove: 240-260 is competitive, 280+ is difficult to chase, and 300+ is exceptional. Scorecards don’t lie about pitch difficulty.
T20I Scorecard Analysis: Controlled Aggression
Nine T20I matches, nine different scorecards. But the average first innings total stays around 151—moderate by T20 standards.
Highest T20I Scorecard: India 199/2
Match: India vs Sri Lanka
India posted 199/2 in 20 overs. This scorecard shows what’s possible when batsmen time the ball perfectly.
The run rate was 9.95—good in T20 cricket. But even this “high” score required perfect execution. The boundaries didn’t give way easily.
Rohit Sharma’s Record Scorecard
Match: India vs West Indies, November 6, 2018
Rohit Sharma: 111 not out off 61 balls
This scorecard entry stands alone. It’s the only T20I century at Ekana. Rohit’s strike rate was 181.97—he didn’t just survive, he destroyed.
His innings included massive sixes over 70-meter boundaries. Perfect timing made the difference. This scorecard proves that class can overcome conditions.
The Ekana stadium highest score in T20 internationals belongs to Rohit. His scorecard remains the gold standard.
Karim Janat’s Bowling Scorecard
Match: Afghanistan vs West Indies, November 16, 2019
Karim Janat: 5 wickets for 11 runs in 4 overs
This bowling scorecard is phenomenal. The economy of 2.75 in T20 cricket shows complete dominance.
Janat used slower balls, cutters, and the pitch’s natural slowness. West Indies couldn’t handle his variations. His figures remain the best T20I bowling performance at Ekana.
Typical T20I Scorecard Patterns
Looking at multiple Ekana Cricket Stadium T20 Records scorecard entries:
- First innings: 145-165 typical
- Second innings: 120-145 typical
- Powerplay scores: 40-55 (moderate)
- Middle overs economy: 6-7 runs per over
- Death overs: 10-12 runs per over
These numbers are 20-30 runs per innings lower than modern T20 averages elsewhere.
Why T20 Scorecards Stay Controlled?
The pitch’s slow nature limits explosive batting. Big boundaries reduce six-hitting. Spinners dominate the middle overs.
Even the best T20 batsmen respect this venue. Scorecards prove it’s not a six-hitting paradise.
IPL Scorecard Behavior: Lucknow Super Giants’ Challenge
Since 2022, Lucknow Super Giants have played home IPL matches at Ekana. The scorecards show interesting patterns.
IPL vs International Scorecards
Ekana cricket stadium records ipl show slightly higher scoring:
- IPL first innings: 165-190 typical
- International T20Is: 145-165 typical
- Difference: 15-25 runs
Why? IPL has specialist power-hitters who know the ground better. Franchise teams practice at the venue regularly.
Typical IPL Scorecard Breakdown
Analyzing Ekana cricket stadium ipl records scorecard entries:
Powerplay (1-6 overs):
- Runs: 45-55
- Wickets: 1-2
- Economy: 7.5-9.0
Middle Overs (7-15):
- Runs: 65-75
- Wickets: 3-4
- Economy: 7.0-8.5
Death Overs (16-20):
- Runs: 55-65
- Wickets: 2-3
- Economy: 10-13
Total: 165-190 typical first innings scores.
Why 200+ Scorecard Totals Are Rare?
Even in IPL, crossing 200 is difficult at Ekana. The pitch doesn’t allow it easily. Big boundaries punish mishits.
Most IPL venues see multiple 200+ scores each season. Ekana rarely does. The Lucknow stadium T20 records ipl scorecard collection shows this clearly.
LSG’s Home Advantage?
Scorecards show Lucknow Super Giants don’t dominate at home as some teams do. The pitch’s challenging nature keeps matches competitive.
Home teams win slightly more often, but not overwhelmingly. Good cricket wins, not just local knowledge.
IPL Scorecard Patterns Summary
The Ekana cricket stadium T20 records ipl prove even franchise cricket’s best batsmen find this venue tough. Scorecards stay controlled compared to Chinnaswamy or Wankhede.
Why Scorecards Favor Bowlers Over Batters?
Looking at all formats together, the numbers are clear.
Bowling Success Metrics
In Tests:
- Two five-wicket hauls in one match
- Both by spinners
- Economy rates under 3 runs per over
In ODIs:
- Average economy: 4.8-5.2 (lower than most venues)
- Spinners average 2-3 wickets per match
- Middle-overs economy: 4-5 runs per over
In T20Is:
- Death over economy: 10-12 (lower than 12-14 elsewhere)
- Spinners maintain a 7-8 economy in T20s
- Five-wicket haul achieved (rare in T20s)
Batting Struggle Metrics
Century Frequency:
- Tests: 1 century in 4 innings (25%)
- ODIs: 3 centuries in 28+ innings (<10%)
- T20Is: 1 century in 18+ innings (<5%)
Compare this to batsman-friendly venues where centuries happen in 15-20% of innings.
Scorecard Evidence
Every scorecard across formats shows:
- Wickets cluster in the middle overs
- Run rates drop after power play
- Big partnerships are rare
- Lower-order collapses are common
- Defending totals is easier than elsewhere
The pitch’s slow, low nature appears in every single scorecard. Numbers don’t lie.
India’s Performance Summary: Honest Assessment
How do India’s scorecards look at Ekana?
Test Cricket
India hasn’t played a Test here yet. We can’t analyze their Test scorecards at this venue.
ODI Cricket Scorecards
India has played multiple ODIs with mixed results:
- Wins: Several, including comfortable victories against lower-ranked teams
- Losses: Some close defeats
- Batting performances: Solid but not dominant. Indian batsmen respect the pitch.
- Bowling performances: Excellent. Indian spinners use conditions brilliantly.
India’s ODI scorecards here don’t show overwhelming dominance despite home advantage.
T20I Cricket Scorecards
India’s T20I performances include memorable moments:
- Rohit’s 111* scorecard
- India’s 199/2 against Sri Lanka
- Several close finishes
India wins more often than it loses, but scorecards show competitive matches. The pitch doesn’t automatically favor home teams.
Overall India Scorecard Pattern
India performs well but doesn’t dominate. The pitch’s challenging nature keeps matches interesting regardless of team rankings.
Final Verdict: Format Difficulty Ranking
Looking at all scorecards across formats, here’s the honest ranking:
Rank 1: Test Cricket (Extremely Tough)
Average first innings: 187
Scorecard evidence:
- Only one century in four innings
- Third innings average drops to 120
- Fourth innings are nearly impossible
- Multiple five-wicket bowling hauls
Test scorecards at Ekana show batting is a survival mission.
Rank 2: ODI Cricket (Challenging But Fair)
Average first innings: 226
Scorecard evidence:
- Three centuries in 28+ innings
- 311 is the highest total (moderate by ODI standards)
- Chasing teams succeed 71% of the time
- 240-260 totals are competitive
ODI scorecards show the pitch is tough but manageable with skill.
Rank 3: T20I/IPL (Controlled But Playable)
Average first innings: 151 (T20I), 165-190 (IPL)
Scorecard evidence:
- Rohit’s 111* proves big scores possible
- 180-200 totals achievable with perfect execution
- Still 20-30 runs below typical T20 averages
- Bowlers have genuine advantages
T20 scorecards show this isn’t a flat pitch, but good batsmen can score.
Overall Scorecard Conclusion
BRSABV Ekana Cricket Stadium Records in Test, ODIs, and T20I prove this venue challenges batsmen across all formats. But the difficulty level varies significantly by format.
Tests are nightmares. ODIs are tough but fair fights. T20s give batsmen fighting chances.
Conclusion: What Scorecards Reveal
Every scorecard from Ekana tells a consistent story. This pitch doesn’t give batsmen anything easy. The slow surface, low bounce, and massive boundaries create unique challenges.
Key scorecard patterns:
- Total runs are lower than typical Indian venues
- Wickets cluster in the middle overs across formats
- Spinners dominate bowling figures
- Centuries are rare achievements
- Defending totals is easier than chasing (except ODIs)
The Ekana cricket stadium records scorecard collection across seven years shows remarkable consistency. The pitch’s character doesn’t change—it always rewards smart, tactical cricket over aggressive, risky cricket.
Future Outlook
India vs South Africa 4th T20I on December 17, 2025, will add another scorecard to this collection. Expect controlled scoring, spin dominance, and tactical batting.
As more matches get played, scorecard averages might shift slightly. But the fundamental nature won’t change—Ekana will always be a bowler-friendly venue where batsmen must earn every run.
For cricket fans analyzing scorecards, Ekana offers something rare in modern cricket: genuine balance between bat and ball, with a slight tilt toward bowling. That’s what makes it valuable.