This guide provides direct data comparison between two major T20 leagues entering the 2026 season.
The ipl vs psl comparison 2026 focuses on structural differences, financial metrics, and operational scale.
Both leagues operate under distinct economic models with different governance structures and market access.
This reference document presents verified statistics without subjective analysis, allowing readers to draw their own conclusions based on factual data.
IPL vs PSL Comparison 2026

The comparison covers league formation, team structure, player economics, broadcast reach, and championship records.
All figures represent the most recent available data as of early 2025.
Side-by-Side League Overview
| Metric | IPL | PSL |
|---|---|---|
| Start Year | 2008 | 2016 |
| Total Seasons | 17 completed (18th ongoing) | 9 completed (10th ongoing) |
| Current Teams | 10 | 6 |
| Matches Per Season | 74 (league stage) | 30 (league stage) |
| Salary Structure | Auction model | Auction model (from 2026) |
| Team Salary Cap | ₹120 crore | $1.6 million |
| Revenue Scale | $1+ billion annually | $50-60 million annually |
| Broadcast Coverage | 140+ territories | South Asia + select markets |
| Governing Body | BCCI | PCB |
Administrative Origin
- How IPL Was Established?
The BCCI launched the IPL in 2007 following the success of Twenty20 formats at the 2007 T20 World Cup. The inaugural season occurred in 2008 with eight franchises acquired through competitive bidding. The league introduced private ownership of teams and an auction-based player acquisition system from its inception.
- How PSL Was Established?
The PCB founded the PSL in 2015 to revive domestic cricket infrastructure and create commercial opportunities for Pakistani players. The first season took place during the 2015-16 period with six franchises. Initial editions were held partially outside Pakistan due to security concerns, with full domestic hosting achieved in subsequent years.
Seasonal Depth and Match Volume
- IPL Match Density
The IPL 2025 season spans 66 days from March 21 to May 25, featuring 74 league matches before playoffs. Each team plays 14 league matches. The expanded ten-team format increased total matches from 60 in the eight-team era, providing additional broadcast inventory.
- PSL Match Density
The PSL 2025 season featured 30 league matches with each team playing 10 games. The tournament typically operates within a 4-6 week window, delivering a more concentrated competition format. This structure accommodates Pakistan’s international cricket calendar and Champions Trophy hosting commitments.
Team Count and Competitive Balance
- IPL Team Diversity
Ten franchises spread player talent across additional squads while increasing total competition duration. Each franchise maintains 25-player rosters with maximum retention rules and right-to-match options during mega auctions. The structure supports both established stars and emerging players across multiple markets.
- PSL Team Concentration
Six franchises represent major Pakistani cities: Karachi, Lahore, Islamabad, Peshawar, Quetta, and Multan. This concentration maintains higher talent density per squad while limiting overall commercial inventory. The PCB has not expanded beyond six teams since the league’s launch.
Individual Performance Benchmarks
- IPL Career Records
Virat Kohli: 8,004 runs across 17 seasons, maintaining the highest aggregate scoring record in league history. Yuzvendra Chahal: 205 wickets across multiple franchises, establishing the wicket-taking benchmark. Both records reflect longevity within the league structure.
- PSL Career Records
Babar Azam: 3,504 runs across nine seasons, leading all PSL batters. Wahab Riaz: 113 wickets before international retirement, holding the all-time PSL wicket-taking record. Career totals reflect the league’s shorter operational history and fewer matches per season.
Title Winners Snapshot
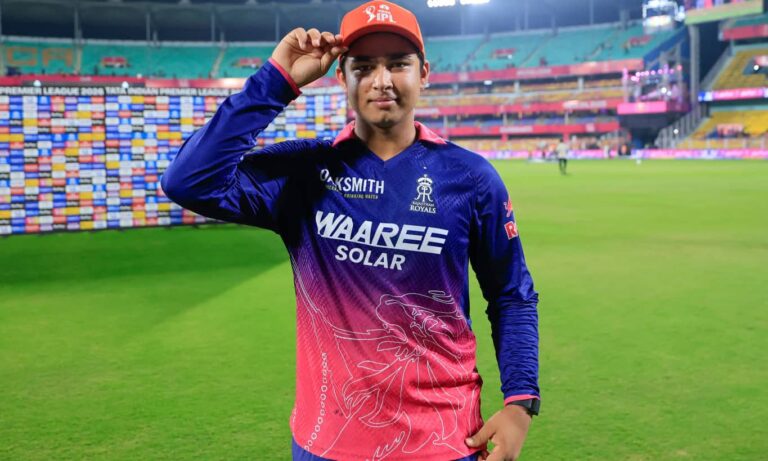
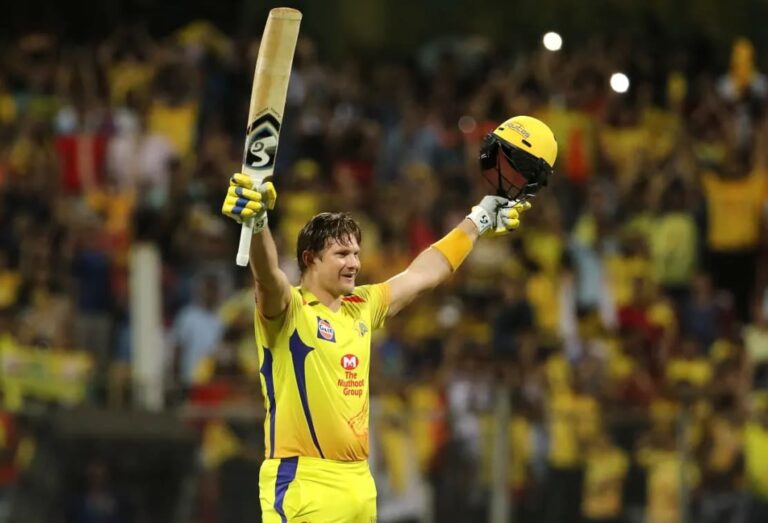
- IPL Championship Markers
First Champion: Rajasthan Royals (2008) under Shane Warne’s captaincy, defeating Chennai Super Kings. Latest Champion: Kolkata Knight Riders (2024) under Shreyas Iyer’s leadership, defeating Sunrisers Hyderabad. Five different franchises have won IPL titles across 17 seasons.
- PSL Championship Markers
First Champion: Islamabad United (2016) under Misbah-ul-Haq’s captaincy. Latest Champion: Islamabad United (2024), securing their third title and maintaining status as PSL’s most successful franchise. Four of six teams have won championships.
Prize Money Comparison
The IPL vs PSL Prize Comparison 2026 shows significant financial disparities in tournament rewards.
| Position | IPL 2024 | PSL 2024 | Difference |
|---|---|---|---|
| Champions | ₹20 crore ($2.42M) | ₹4.13 crore ($500K) | ₹15.87 crore |
| Runners-up | ₹12.5 crore ($1.43M) | ₹1.65 crore ($200K) | ₹10.85 crore |
| Third Place | ₹7 crore ($846K) | Not allocated | N/A |
| Fourth Place | ₹6.5 crore ($785K) | Not allocated | N/A |
| Total Prize Pool | ₹46 crore ($5.56M) | ₹5.78 crore ($700K) | ₹40.22 crore |
Player Cost and Team Budgets
- IPL High-Value Signings
Rishabh Pant holds the record at ₹27 crore ($3.26 million) from the 2025 mega auction, acquired by Lucknow Super Giants. This single contract exceeds the PSL’s entire team salary cap. Other 2025 auction signings included Shreyas Iyer at ₹26.75 crore and Yuzvendra Chahal at ₹18 crore.
- PSL Budget Constraints
The PSL shifted to an auction model in 2026 with team salary caps set at $1.6 million per franchise. Previous draft systems capped individual players at $300,000 in the Platinum category. The new structure allows market-based pricing within significantly lower budget parameters than IPL operations.
Audience Reach and Media Exposure
- IPL Audience Scale
2024 viewership: 620 million on JioCinema digital platform, 510 million on Star Sports television. Media rights sold for $6.4 billion covering four seasons (2023-2027), establishing per-match valuation at $13.4 million. Broadcast distribution reaches 140+ territories globally.
- PSL Audience Scale
2024 viewership: 150 million digital views according to PCB statements. Media rights acquired by A Sports and Walee Technologies for $24 million across multiple seasons. The IPL vs PSL Comparison 2026 Popularity demonstrates a 4:1 digital viewership ratio favoring the IPL.
2025 Points Table Reference
IPL 2025 Points Table
| Pos | Team | P | W | L | NR | Pts | NRR |
|---|---|---|---|---|---|---|---|
| 1 | PBKS (Q) | 14 | 9 | 4 | 1 | 19 | +0.372 |
| 2 | RCB (Q) | 14 | 9 | 4 | 1 | 19 | +0.301 |
| 3 | GT (Q) | 14 | 9 | 5 | 0 | 18 | +0.254 |
| 4 | MI (Q) | 14 | 8 | 6 | 0 | 16 | +1.142 |
| 5 | DC (E) | 14 | 7 | 6 | 1 | 15 | +0.011 |
| 6 | SRH (E) | 14 | 6 | 7 | 1 | 13 | -0.241 |
| 7 | LSG (E) | 14 | 6 | 8 | 0 | 12 | -0.376 |
| 8 | KKR (E) | 14 | 5 | 7 | 2 | 12 | -0.305 |
| 9 | RR (E) | 14 | 4 | 10 | 0 | 8 | -0.549 |
| 10 | CSK (E) | 14 | 4 | 10 | 0 | 8 | -0.647 |
PSL 2025 Points Table
| Pos | Team | M | W | L | T | N/R | Pts | NRR |
|---|---|---|---|---|---|---|---|---|
| 1 | Quetta Gladiators | 10 | 7 | 2 | 0 | 1 | 15 | +1.393 |
| 2 | Islamabad United | 10 | 6 | 4 | 0 | 0 | 12 | +0.372 |
| 3 | Karachi Kings | 10 | 6 | 4 | 0 | 0 | 12 | +0.049 |
| 4 | Lahore Qalandars | 10 | 5 | 4 | 0 | 1 | 11 | +1.036 |
| 5 | Peshawar Zalmi | 10 | 4 | 6 | 0 | 0 | 8 | -0.293 |
| 6 | Multan Sultans | 10 | 1 | 9 | 0 | 0 | 2 | -2.449 |
Conclusion:
The ipl vs psl comparison 2026 demonstrates measurable differences across financial, operational, and commercial metrics.
- Scale
The IPL operates with 10 teams and 74 league matches versus PSL’s 6 teams and 30 matches. Player acquisition budgets differ by a factor of approximately 50:1 when comparing team salary caps.
- Revenue
Media rights valuations show a 267:1 ratio ($6.4 billion vs $24 million). Prize pool differences reach 7.9:1 for total distribution. Annual revenue estimates place IPL above $1 billion against PSL’s $50-60 million range.
- Exposure
Digital viewership ratios stand at 4:1 based on 2024 data. Broadcast distribution spans 140+ territories for IPL, compared toa South Asian regional focus for PSL. Per-match media valuation reaches $13.4 million for IPL content.
- Competitive Impact
Statistical records show Kohli’s 8,004 IPL runs versus Babar’s 3,504 PSL runs, reflecting both longevity and match volume differences. The data confirms the ipl is a bigger league than psl across quantifiable commercial and operational parameters.