Greenfield International Stadium Records in T20Is, ODI, and Test with Current Pitch Report
Kerala’s premier cricket venue in Thiruvananthapuram has compiled a brief but telling international record since 2018.
Examining the Greenfield International Stadium records in T20Is, odi, and tests with the current pitch report provides crucial insights for teams preparing to compete at this ground.
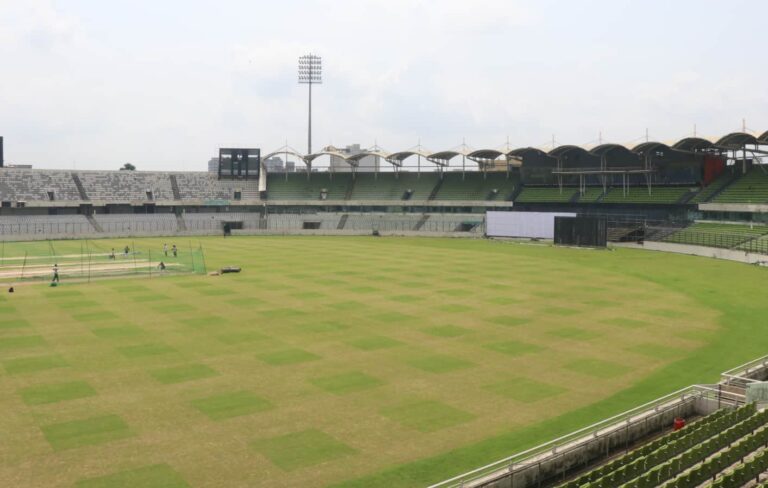
The facility, constructed on 36 acres leased from Kerala University, accommodates 50,000 spectators and operates under Kerala Cricket Association management.
Limited match history exists compared to established Indian venues, yet clear patterns have emerged. Bowling units consistently outperform batting lineups across all three formats.
The ground’s characteristics create specific challenges that visiting teams must address through careful selection and tactical planning.
Greenfield International Stadium Records and Pitch Report

Greenfield International Ground Pitch Report
| Pitch Attribute | Characteristics |
|---|---|
| Base Material | Grass surface |
| Playing Conditions | Favors bowling |
| Bowling Support | Early seam, later spin |
| Bounce Pattern | Reliable throughout |
| Run Rate Tendency | Moderate to low |
- Seam Bowlers Exploit Initial Conditions: The new ball generates significant lateral movement during opening overs. Moisture retention in the grass surface allows seamers to create problems for opening batsmen, particularly when cloud cover increases atmospheric humidity.
- Spin Bowling Effectiveness Increases: After the initial powerplay phases, the ball starts gripping the surface. Spinners operating from both ends can slow scoring rates dramatically, with the pitch offering consistent turn without excessive breakage.
- Stroke Play Limitations Persist: Batsmen find themselves constantly adjusting to variable pace and movement. The pitch prevents free-flowing innings, demanding concentration and defensive technique over aggressive shot selection throughout all formats.
- Evening Sessions Provide Marginal Relief: Floodlit matches occasionally see improved batting conditions during the second innings. Dew accumulation reduces spin effectiveness, though the advantage remains limited compared to other Indian venues.
Greenfield International Ground Dimensions
| Boundary Position | Relative Distance |
|---|---|
| Leg Side Square | Standard length |
| Off-Side Square | Standard length |
| Straight Boundaries | Extended distance |
| Fine Leg/Third Man | Reduced distance |
Boundary specifications at this venue create additional complications for batsmen seeking quick runs.
Straight hits require exceptional timing and power due to extended dimensions down the ground.
Players attempting big shots over mid-wicket or long-off frequently fall short, resulting in caught dismissals.
The shorter square boundaries behind the wicket provide scoring opportunities for players executing deflections and guides.
Upper cuts, ramps, and paddle shots become viable options, though the pitch conditions make even these shots risky propositions against quality bowling.
Greenfield International Cricket Stadium Records and Venue Stats: T20, T10, ODI, Test
| Match Format | Total Games | First Innings Avg | Peak Score | Minimum Score |
|---|---|---|---|---|
| T20 Internationals | 4 | 144 | 235 | 67 |
| One Day Internationals | 4 | 144 | 235 | 67 |
| Test Matches | 2 | 247 | 390 | 73 |
Cross-format comparison reveals bowling dominance remains constant regardless of match length.
White-ball formats produce identical first innings averages, suggesting similar pitch behavior in both T20 and ODI cricket.
Test cricket shows elevated scoring due to extended batting opportunities across four innings.
The range between the highest and lowest scores indicates extreme variability in match outcomes.
Teams either collapse completely or manage competitive totals through disciplined application.
Few matches feature comfortable batting conditions throughout their duration.
Greenfield International Cricket Stadium Records in T20I
| Record Category | Figure |
|---|---|
| Completed Matches | 4 |
| First Innings Wins | 2 |
| Second Innings Wins | 2 |
| First Innings Average | 144 |
| Second Innings Average | 133 |
| Maximum Total | 235 |
| Successful Chase Peak | 173 |
| Defended Minimum | 67 |
- Equal Outcomes Batting First and Second: T20 internationals show perfect balance with two wins apiece for teams batting and bowling first. Neither decision provides an overwhelming advantage, though Greenfield International Stadium records in T20Is, odi, and test with current pitch report suggest execution quality determines results.
- Scores Fall Below International Standards: First innings totals averaging 144 represent substantial underperformance compared to global T20 norms. Bowling attacks consistently restrict opposition scoring, creating pressure situations from opening deliveries through final overs.
- Chase Success Requires Exceptional Skill: The maximum successfully pursued target of 173 demonstrates that chasing remains achievable with quality batting. However, second innings averages dropping to 133 indicate most teams fail to handle pressure situations when batting second.
Greenfield International Cricket Stadium Records in ODIs
| Performance Metric | Data |
|---|---|
| ODIs Hosted | 4 |
| Batting First Victories | 2 |
| Bowling First Victories | 2 |
| First Innings Mean | 144 |
| Second Innings Mean | 133 |
| Highest Posted | 235 |
| Highest Chased | 173 |
| Lowest Defense | 67 |
- Toss Decision Shows No Clear Pattern: ODI captains winning tosses have split decisions evenly between batting and bowling. Match-specific factors, including weather forecasts, team composition, and opposition strength,s influence toss calls more than venue history.
- Chasing Success Exists But Remains Difficult: Overall statistics across formats indicate 9 of 14 matches ended with chasing teams victorious. This contradicts typical assumptions about bowling-friendly venues, suggesting nighttime dew and settling pitches provide genuine second innings advantages.
- Totals Remain Significantly Below Par: ODI cricket typically sees first innings scores exceeding 250 at most international venues. The 144 average here represents nearly 100-run shortfalls, emphasizing how thoroughly bowlers dominate proceedings throughout 50-over contests.
Greenfield International Cricket Stadium Records in Test
| Test Match Data | Statistics |
|---|---|
| Total Tests | 2 |
| First Batting Wins | 1 |
| Second Batting Wins | 1 |
| First Innings Mean | 247 |
| Second Innings Mean | 89 |
| Peak Total | 390 |
| Minimum Total | 73 |
| Highest Chase | 105 |
| Lowest Defense | 390 |
- Dramatic Scoring Decline Across Innings: The 158-run difference between first and second innings averages reveals severe pitch deterioration. Teams batting in the third and fourth innings face exponentially more difficult conditions than those batting first.
- Fourth Innings Batting Becomes Futile: Only 105 runs have been successfully chased in Test cricket at this venue. The Greenfield International Stadium records in T20Is, odi, and test with the current pitch report confirming that fourth innings batting presents near-impossible challenges regardless of target size.
- Opening Innings Totals Control Match Outcomes: Teams posting first innings scores around 390 create insurmountable positions. The pitch assists bowlers increasingly as matches progress, eliminating comeback possibilities for teams trailing after two innings.
Greenfield International Stadium: Is Batting Pitch Or Bowling Pitch?
Analysis assigns this venue a 60-40 bowling-to-batting split. Both pace and spin bowling receive assistance throughout match durations, creating continuous pressure on batting units attempting to build substantial totals.
- New Ball Movement Causes Early Damage: Opening bowlers generate swing and seam movement that accounts for regular top-order dismissals. The Greenfield International Stadium records in T20Is, odi, and tests with the current pitch report, demonstrate how effectively seamers exploit initial conditions.
- Spinners Control Middle and Death Phases: Once pace bowlers complete their opening spells, spinners assume control with gripping deliveries that restrict run flow. Batsmen cannot accelerate freely against quality spin bowling on this surface.
- Boundaries Require Significant Effort: Scoring rates remain suppressed across all formats due to bowling assistance. Batsmen must work extensively for boundary opportunities, with mishits and false shots occurring regularly throughout innings.
Type Of Pitch
- First Phase Bowling Conditions: Opening sessions and powerplay overs provide maximum seam movement. Cloud cover enhances swing bowling, while the hard new ball bounces consistently, creating difficulties for batsmen adjusting to pace and bounce.
- Middle Session Characteristics: Spinners begin finding turn and bounce as the ball softens. The pitch surface maintains its grip, preventing batsmen from dominating proceedings. Defensive fields restrict scoring options during this crucial phase.
- Final Phase Challenges: Unlike many venues where pitches flatten during death overs, this surface maintains bowling assistance. Seamers return with older balls that reverse, while spinners continue extracting turn, making aggressive batting risky throughout the closing stages.
Weather Report & Forecast
- Humidity Levels Impact Play: Thiruvananthapuram’s coastal climate produces persistent humidity that enhances swing bowling. Atmospheric moisture helps fast bowlers move the ball laterally, particularly during morning sessions and under evening lights.
- Precipitation Risks Throughout Year: Rainfall probability remains significant across most months due to the region’s tropical location. Covers frequently protect playing surfaces between sessions, with DLS calculations required when rain interrupts limited-overs matches.
- Wind Patterns Affect Bowling: Sea breezes influence ball movement depending on wind direction. Bowlers operating with the wind generate additional swing, while those bowling into the breeze must adjust lengths and lines accordingly.
- Dew Factor in Night Games: Evening matches experience dew accumulation that impacts ball grip for bowlers. Spinners particularly struggle to maintain control, giving batting sides modest advantages during the second innings of day-night fixtures.
Conclusion:
Comprehensive analysis of the Greenfield International Stadium records in T20Is, odi, and tests with the current pitch report confirms this venue distinctly favors bowling across formats.
Teams must construct balanced squads emphasizing bowling depth rather than relying primarily on batting strength.
- Surface Characteristics Favor Bowlers: The pitch provides consistent assistance to pace and spin bowling throughout matches. Batting requires patience and technical skill rather than aggressive intent.
- Second Innings Strategy Proves Beneficial: Despite bowling-friendly conditions, chasing teams have won 64% of matches. Captains should strongly consider bowling first after winning tosses.
- Conservative Batting Approaches Succeed: Totals near 150 in white-ball cricket prove competitive. Teams should prioritize wicket preservation over aggressive scoring, building innings through calculated risk-taking rather than sustained boundary-hitting.
Also Check:
- BRSABV Ekana Cricket Stadium Records
- HPCA Stadium Dharamsala Records
- Most Beautiful Cricket Stadium In The World
- Maharaja Yadavindra Singh International Cricket Stadium Records
- Narendra Modi Stadium Records in Test, ODI, and T20I
- Niranjan Shah Stadium Rajkot Records in ODI, T20I & Test
- Holkar Cricket Stadium Indore Records
- VCA Stadium Jamtha Nagpur Record
- Dr. Y.S. Rajasekhara Reddy ACA VDCA Cricket Stadium Records