Understanding the most dangerous batsmen of ipl history 2026 requires analyzing impact mechanics, not aggregate statistics.
Raw run totals measure volume, not threat level. A batter scoring 600 runs at 120 strike rate creates less pressure than one scoring 400 at 180 strike rate.
Danger operates through three mechanisms: shot range, boundary conversion rate, and bowling-plan disruption.
Batters with 360-degree shot capability eliminate safe bowling zones.
Boundary conversion measures efficiency scoring boundaries every 4-5 balls forces defensive field placements.
Bowling-plan disruption occurs when captains exhaust premier bowlers early to contain specific batters.
Dot ball percentage reveals pressure absorption. Low dot rates indicate sustained aggression without defensive periods.
Most Dangerous Batsmen Of IPL History
High boundary frequency combined with low dots creates compounding scoreboard pressure that opposition cannot contain through conventional bowling strategies.
Top 10 Dangerous Batsmen Of IPL
| Rank | Player | Matches | Runs | Strike Rate | Boundary Frequency |
|---|---|---|---|---|---|
| 1 | Virat Kohli | 267 | 8661 | 132.85 | Every 4.2 balls |
| 2 | AB de Villiers | 184 | 5162 | 151.68 | Every 3.6 balls |
| 3 | Jos Buttler | 121 | 4120 | 149.38 | Every 3.8 balls |
| 4 | Chris Gayle | 142 | 4965 | 148.96 | Every 3.5 balls |
| 5 | Travis Head | 38 | 1146 | 170.02 | Every 3.6 balls |
| 6 | Abhishek Sharma | 77 | 1816 | 163.01 | Every 3.7 balls |
| 7 | Shreyas Iyer | 133 | 3731 | 133.34 | Every 4.3 balls |
| 8 | Mitchell Marsh | 55 | 1292 | 142.92 | Every 4.0 balls |
| 9 | Rohit Sharma | 272 | 7046 | 132.09 | Every 4.3 balls |
| 10 | Nicholas Pooran | 90 | 2293 | 168.97 | Every 3.7 balls |
List of Most Dangerous Batsmen Of IPL History – Impact Blueprint
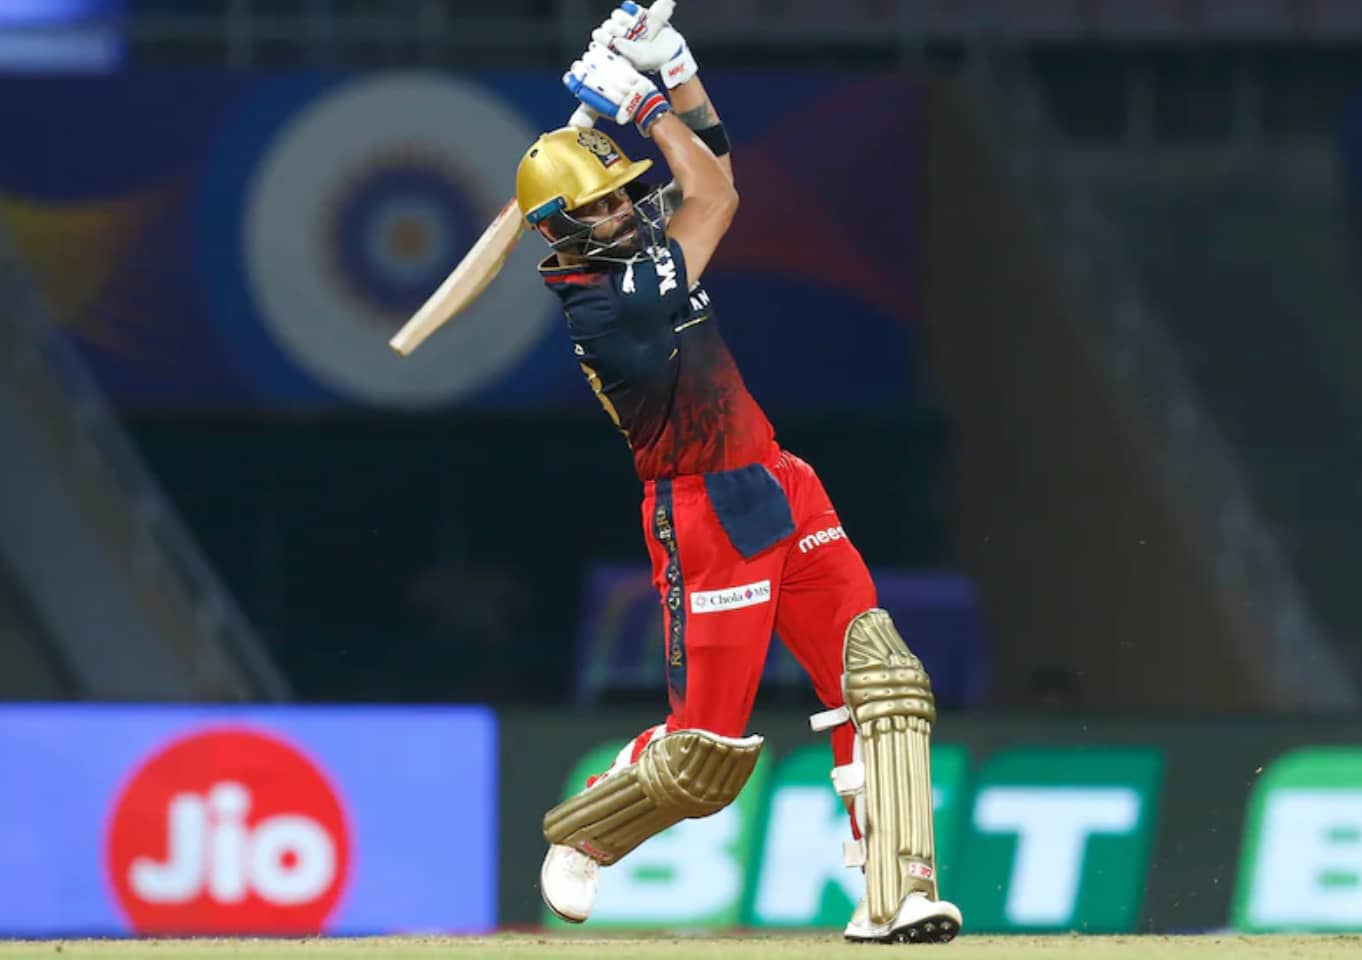
Virat Kohli
| Matches | Runs | Strike Rate | Dot Ball % | Highest Score | 100s/50s |
|---|---|---|---|---|---|
| 267 | 8661 | 132.85 | 32.4 | 113* | 8/63 |
- Shot Arsenal Advantage
Kohli’s wrist work generates boundaries through mid-wicket and square-leg against spin and pace. Cover drives to fuller deliveries create consistent boundary options on both sides of the wicket. Straight hitting to good-length balls eliminates bowler’s safe zones. His shot range spans 180 degrees from cover to mid-wicket, with minimal aerial risk.
- Pressure Creation Method
Low dot ball percentage (32.4%) forces bowlers into length experimentation. Kohli rotates strike efficiently between boundaries, maintaining scoreboard pressure without risk accumulation. His presence forces captains to hold back premier bowlers for death overs, disrupting optimal bowling rotation sequences.
- Risk-to-Reward Ratio
Boundary efficiency of one every 4.2 balls combines with 39.54 average, indicating low dismissal rate relative to scoring rate. His approach prioritizes singles between boundaries rather than consecutive boundary attempts. This creates sustained pressure without innings-ending risk spikes.
- 2026 Tactical Value
Three consecutive 600+ run seasons demonstrate reliable output for team planning. His versatility across positions 1-4 provides lineup flexibility. The combination of consistency and middle-overs acceleration makes him adaptable to various team compositions and match situations.
AB de Villiers
| Matches | Runs | Strike Rate | Dot Ball % | Highest Score | 100s/50s |
|---|---|---|---|---|---|
| 184 | 5162 | 151.68 | 28.6 | 133* | 3/40 |
- Shot Arsenal Advantage
De Villiers pioneered the IPL dangerous batsman 360 degree concept through reverse sweeps, ramp shots, and scoops. His shot range covered the entire ground circumference, eliminating defensive field placement options. Unconventional shots to yorker-length deliveries converted safe balls into boundary opportunities. Aerial shots between fielders reduced dot ball percentage to 28.6%.
- Pressure Creation Method
Field-setting limitations arose from his ability to score in all zones. Captains exhausted bowling options within 15 overs attempting containment. His strike rate acceleration in overs 16-20 forced defensive yorker strategies three overs earlier than normal. Bowlers altered lengths pre-delivery based on field placements rather than batting weaknesses.
- Risk-to-Reward Ratio
Boundary frequency of every 3.6 balls created compounding run-rate pressure. His 39.70 average indicated dismissal rates remained controlled despite aggressive shot selection. The combination of innovation and execution produced high reward without proportional risk increase compared to conventional batting approaches.
- 2026 Tactical Value
Though retired since 2021, de Villiers established tactical frameworks current finishers replicate. His death-over batting templates influence coaching strategies for training unconventional shots. The 360-degree shot range concept now defines elite finishing capability expectations in auction valuations.
Jos Buttler
| Matches | Runs | Strike Rate | Dot Ball % | Highest Score | 100s/50s |
|---|---|---|---|---|---|
| 121 | 4120 | 149.38 | 29.8 | 124 | 7/24 |
- Shot Arsenal Advantage
Buttler’s switch-hit execution removes left-hand/right-hand bowling advantages completely. Scoop shots behind the wicket-keeper access undefended zones against pace bowling. Inside-out drives over covers against spin create boundary options without square-leg fielder relevance. His powerplay shot range forces field-restriction exploitation from over one.
- Pressure Creation Method
Opening partnerships regularly exceed 100 runs, establishing psychological dominance by over 10. His boundary frequency every 3.8 balls forces captains to sacrifice attacking fields within three overs. Powerplay strike rate above 160 creates scoreboard pressure that compounds through remaining innings.
- Risk-to-Reward Ratio
Four centuries in 2022 season demonstrated sustained aggression without dismissal rate escalation. Boundary efficiency combines with 40.00 average, indicating controlled risk despite aggressive intent. His approach prioritizes shot execution over power, maintaining high strike rate through placement rather than force.
- 2026 Tactical Value
Gujarat Titans’ acquisition targeted powerplay destruction capability specifically. His 163.03 strike rate in 2025 GT debut validated immediate tactical impact. Wicketkeeping adds squad flexibility without compromising opening position requirements or batting approach adjustments.
Chris Gayle
| Matches | Runs | Strike Rate | Dot Ball % | Highest Score | 100s/50s |
|---|---|---|---|---|---|
| 142 | 4965 | 148.96 | 26.2 | 175* | 6/31 |
- Shot Arsenal Advantage
Gayle’s straight hitting eliminated good-length bowling effectiveness through power and timing combination. Pull shots to short-pitched deliveries maintained boundary threat across length spectrum. His reach advantage converted yorker-length balls into clearing opportunities. Six-hitting capability (357 career) from defensive deliveries forced negative bowling lines.
- Pressure Creation Method
Lowest dot ball percentage (26.2%) among elite batters created sustained scoreboard acceleration. His boundary frequency every 3.5 balls meant one boundary per over minimum. Captains altered bowling plans before match commencement, indicating psychological pressure beyond statistical threat. Field placements featured seven boundary fielders from over four onwards.
- Risk-to-Reward Ratio
Boundary percentage of 64.1% represented highest conversion rate among established batters. His 39.72 average indicated controlled dismissal rates despite power-hitting approach. The combination of six-hitting frequency and average maintenance created disproportionate reward relative to risk taken.
- 2026 Tactical Value
Retired since 2021, but Gayle’s powerplay destruction template defines current opener selection criteria. His boundary percentage benchmarks influence fantasy player selection and auction valuations. The six-hitting record remains the standard for measuring power-hitting capability across generations.
Travis Head
| Matches | Runs | Strike Rate | Dot Ball % | Highest Score | 100s/50s |
|---|---|---|---|---|---|
| 38 | 1146 | 170.02 | 24.8 | 102 | 1/8 |
- Shot Arsenal Advantage
Head’s square cuts and pulls to short-pitched deliveries create boundary options against pace bowling. His reach allows drives to fuller lengths from spinners without advancing down the pitch. Pull shots maintain effectiveness across pace variations from 120-150 kph. The combination of footwork and shot range eliminates length-based bowling strategies.
- Pressure Creation Method
His 24.8% dot ball rate represents lowest among current IPL batters with 1000+ runs. Sustained aggression across overs 1-10 forces defensive bowling before powerplay ends. The 191.55 strike rate (2024 season) for 550+ run campaigns created unprecedented first-innings pressure. Opposition captains exhaust premier bowling within eight overs attempting containment.
- Risk-to-Reward Ratio
Boundary frequency every 3.6 balls matches de Villiers’ efficiency with higher volume. His 34.72 average indicates dismissal rates remain acceptable relative to strike rate achieved. The approach eliminates traditional consolidation phases, creating continuous pressure without corresponding risk escalation.
- 2026 Tactical Value
Head represents the most dangerous batsman in ipl 2026 through recent form trajectory and strike rate consistency. His Test cricket success eliminates format-transition concerns. The 170.02 career strike rate establishes new benchmarks for opener valuations in upcoming auction cycles.
Abhishek Sharma
| Matches | Runs | Strike Rate | Dot Ball % | Highest Score | 100s/50s |
|---|---|---|---|---|---|
| 77 | 1816 | 163.01 | 26.4 | 141 | 1/9 |
- Shot Arsenal Advantage
Abhishek’s left-handed stance creates natural angles for cover drives against right-arm bowling. Lofted shots down the ground access undefended zones during field restrictions. His ability to clear boundaries to both leg-side and off-side eliminates safe bowling lines. Pull shots to short-pitched deliveries maintain boundary threat across pace variations.
- Pressure Creation Method
Two consecutive seasons above 190 strike rate force opposition into defensive bowling from over two. His 26.4% dot ball rate creates continuous scoreboard movement without consolidation phases. Field placements feature boundary fielders from over three, sacrificing wicket-taking positions. Captains alter bowling sequences to contain rather than dismiss.
- Risk-to-Reward Ratio
Boundary frequency every 3.7 balls maintains elite efficiency despite young career stage. His 27.10 average indicates higher dismissal rates relative to other elite batters, but strike rate compensates through rapid scoring. The approach prioritizes team total maximization over individual average preservation.
- 2026 Tactical Value
India T20I selection validates IPL impact and creates dual-format value proposition. His 141 off 55 balls establishes psychological advantage in auction scenarios. Young age suggests sustained performance potential across multiple IPL seasons, increasing long-term investment value.
Shreyas Iyer
| Matches | Runs | Strike Rate | Dot Ball % | Highest Score | 100s/50s |
|---|---|---|---|---|---|
| 133 | 3731 | 133.34 | 35.2 | 97* | 0/27 |
- Shot Arsenal Advantage
Iyer’s pull and hook shots to short-pitched bowling create consistent boundary options against pace. His ability to use feet against spin generates drive opportunities down the ground. Back-foot play creates square cuts and pulls to good-length deliveries. The 2025 transformation showcased expanded shot range beyond traditional leg-side dominance.
- Pressure Creation Method
His 2025 strike rate of 175.07 forced bowling changes within five-over spells. Middle-overs acceleration eliminates traditional consolidation expectations from number three position. Opposition captains face dilemma—use spinners early and face boundary threat, or delay and lose containment advantage.
- Risk-to-Reward Ratio
Boundary frequency every 4.3 balls represents moderate efficiency but improved significantly in 2025. His 34.22 average indicates controlled dismissal rates across career. The strike rate transformation from 133.34 career to 175.07 (2025) demonstrates tactical evolution without proportional risk increase.
- 2026 Tactical Value
Leadership experience with three franchises reaching finals adds strategic value. His first 600-run season with elite strike rate validates adaptation to modern IPL requirements. The combination of captaincy capability and batting transformation increases auction value through dual utility.
Mitchell Marsh
| Matches | Runs | Strike Rate | Dot Ball % | Highest Score | 100s/50s |
|---|---|---|---|---|---|
| 55 | 1292 | 142.92 | 30.6 | 117 | 1/9 |
- Shot Arsenal Advantage
Marsh’s pull shots generate boundaries against short-pitched bowling from both pace and spin. Drives to fuller lengths create scoring options through covers and long-off. His reach advantage allows boundary-hitting without advancing down the pitch. The combination of power and placement reduces reliance on pure force.
- Pressure Creation Method
His 2025 breakthrough at 163.70 strike rate forced defensive fields within powerplay. Opening role eliminated middle-order pressure considerations, allowing sustained aggression. Boundary frequency every 4.0 balls creates consistent scoreboard movement. His bowling capability forces captains into resource allocation compromises.
- Risk-to-Reward Ratio
His 27.48 average indicates higher dismissal rates relative to scoring achieved, but strike rate compensates. Boundary efficiency improved dramatically in 2025 compared to prior seasons. The all-rounder utility provides value beyond batting statistics—bowling contributions justify batting risk levels.
- 2026 Tactical Value
World Cup-winning form carried directly into IPL 2025 breakthrough. The 627-run season at 163.70 strike rate established new performance baseline. All-rounder status increases auction value through squad composition flexibility and bowling depth contributions.
Rohit Sharma
| Matches | Runs | Strike Rate | Dot Ball % | Highest Score | 100s/50s |
|---|---|---|---|---|---|
| 272 | 7046 | 132.09 | 34.8 | 109* | 2/47 |
- Shot Arsenal Advantage
Rohit’s pull shots to short-pitched bowling create boundary options without excessive power requirements. Cover drives generate consistent scoring through timing rather than force. His ability to create room against spin allows inside-out shots over covers. Straight hitting to good-length deliveries maintains boundary threat across length spectrum.
- Pressure Creation Method
Powerplay strike rate above 140 establishes platform for middle-order acceleration. His opening partnerships with various batters demonstrate adaptability across different partner styles. Low dot ball percentage in overs 1-6 forces field changes within powerplay. Captains hold premier bowlers for death overs, disrupting optimal rotation.
- Risk-to-Reward Ratio
Boundary frequency every 4.3 balls represents moderate efficiency focused on sustainability. His 29.73 average indicates dismissal rates remain controlled relative to career length. The approach prioritizes team requirements over individual statistics—strike rate adjusts based on match situation.
- 2026 Tactical Value
Five IPL championship titles demonstrate pressure-batting capability and tactical expertise. Leadership experience maintains value despite inconsistent recent form. Opening capability combined with captaincy provides team composition flexibility that younger aggressive openers cannot replicate.
Nicholas Pooran
| Matches | Runs | Strike Rate | Dot Ball % | Highest Score | 100s/50s |
|---|---|---|---|---|---|
| 90 | 2293 | 168.97 | 25.3 | 87* | 0/14 |
- Shot Arsenal Advantage
Pooran’s straight hitting over long-on and long-off eliminates death-over yorker effectiveness. His ability to create room against pace bowling generates boundary options square of the wicket. Slog-sweeps against spin access undefended zones despite defensive field settings. Left-handed stance creates natural angles forcing right-arm bowlers outside off-stump.
- Pressure Creation Method
His 25.3% dot ball rate represents elite pressure maintenance in death-over situations. Boundary frequency every 3.7 balls forces captains to use premier bowlers by over 16. The 2025 season featured most sixes hit, indicating consistent power execution under pressure. Opposition strategies center on containment rather than dismissal attempts.
- Risk-to-Reward Ratio
His 34.22 average indicates controlled dismissal rates despite aggressive finishing role. Boundary efficiency matches elite power hitters while maintaining lower dismissal frequency. The 168.97 strike rate combines with wicketkeeping utility, creating value beyond pure batting contribution.
- 2026 Tactical Value
Global T20 league consistency demonstrates reliability beyond isolated IPL performances. His status as only batter with 3000+ T20 runs since 2024 validates sustained form. Wicketkeeping adds tactical flexibility while maintaining death-over finishing capability and aggressive intent.
Conclusion:
The most dangerous batsmen of ipl history 2026 represents tactical evolution where impact measurement supersedes volume accumulation.
Modern IPL batting prioritizes boundary efficiency and pressure creation over traditional average preservation.
Framework insights:
- Technique vs brute force: Elite batters combine shot range with placement precision. Gayle’s power (64.1% boundary rate) contrasts with Kohli’s wrist work (4.2-ball boundary frequency), yet both create equivalent pressure through different mechanics.
- T20 batting evolution: Dot ball percentages declined from 35%+ in early IPL seasons to sub-25% among current elite batters. The Most Dangerous Batsmen Of IPL History now maintain strike rates above 160 while controlling dismissal frequencies below career norms.
- Versatility premium: Multi-phase threats (de Villiers, Gayle) created value across powerplay and death overs. Current specialists dominate single phases with higher efficiency. IPL 2026 auctions increasingly value adaptability—batters who adjust strike rates based on match requirements rather than fixed approaches.
- High-risk amplification: Field-restriction rules and impact player substitutions amplify aggressive batting rewards. Batters maintaining 170+ strike rates (Head, Pooran) generate disproportionate value relative to 130-140 range despite lower averages.
Also Check:
- Most Expensive Players in IPL History
- Highest CSK Scores In IPL History
- Highest MI Scores In IPL History
- Players With The Most Catches In IPL History
- Youngest Player In IPL History
- Most Expensive Player in IPL Auction History
- Most Unsuccessful IPL Team in History
- Players Who Hit Five Sixes In An Over in IPL